The 70% Bankruptcy Myth:
Exposed
A 32-year study of 180 documented Powerball jackpot winners reveals the truth behind America's most viral financial myth.
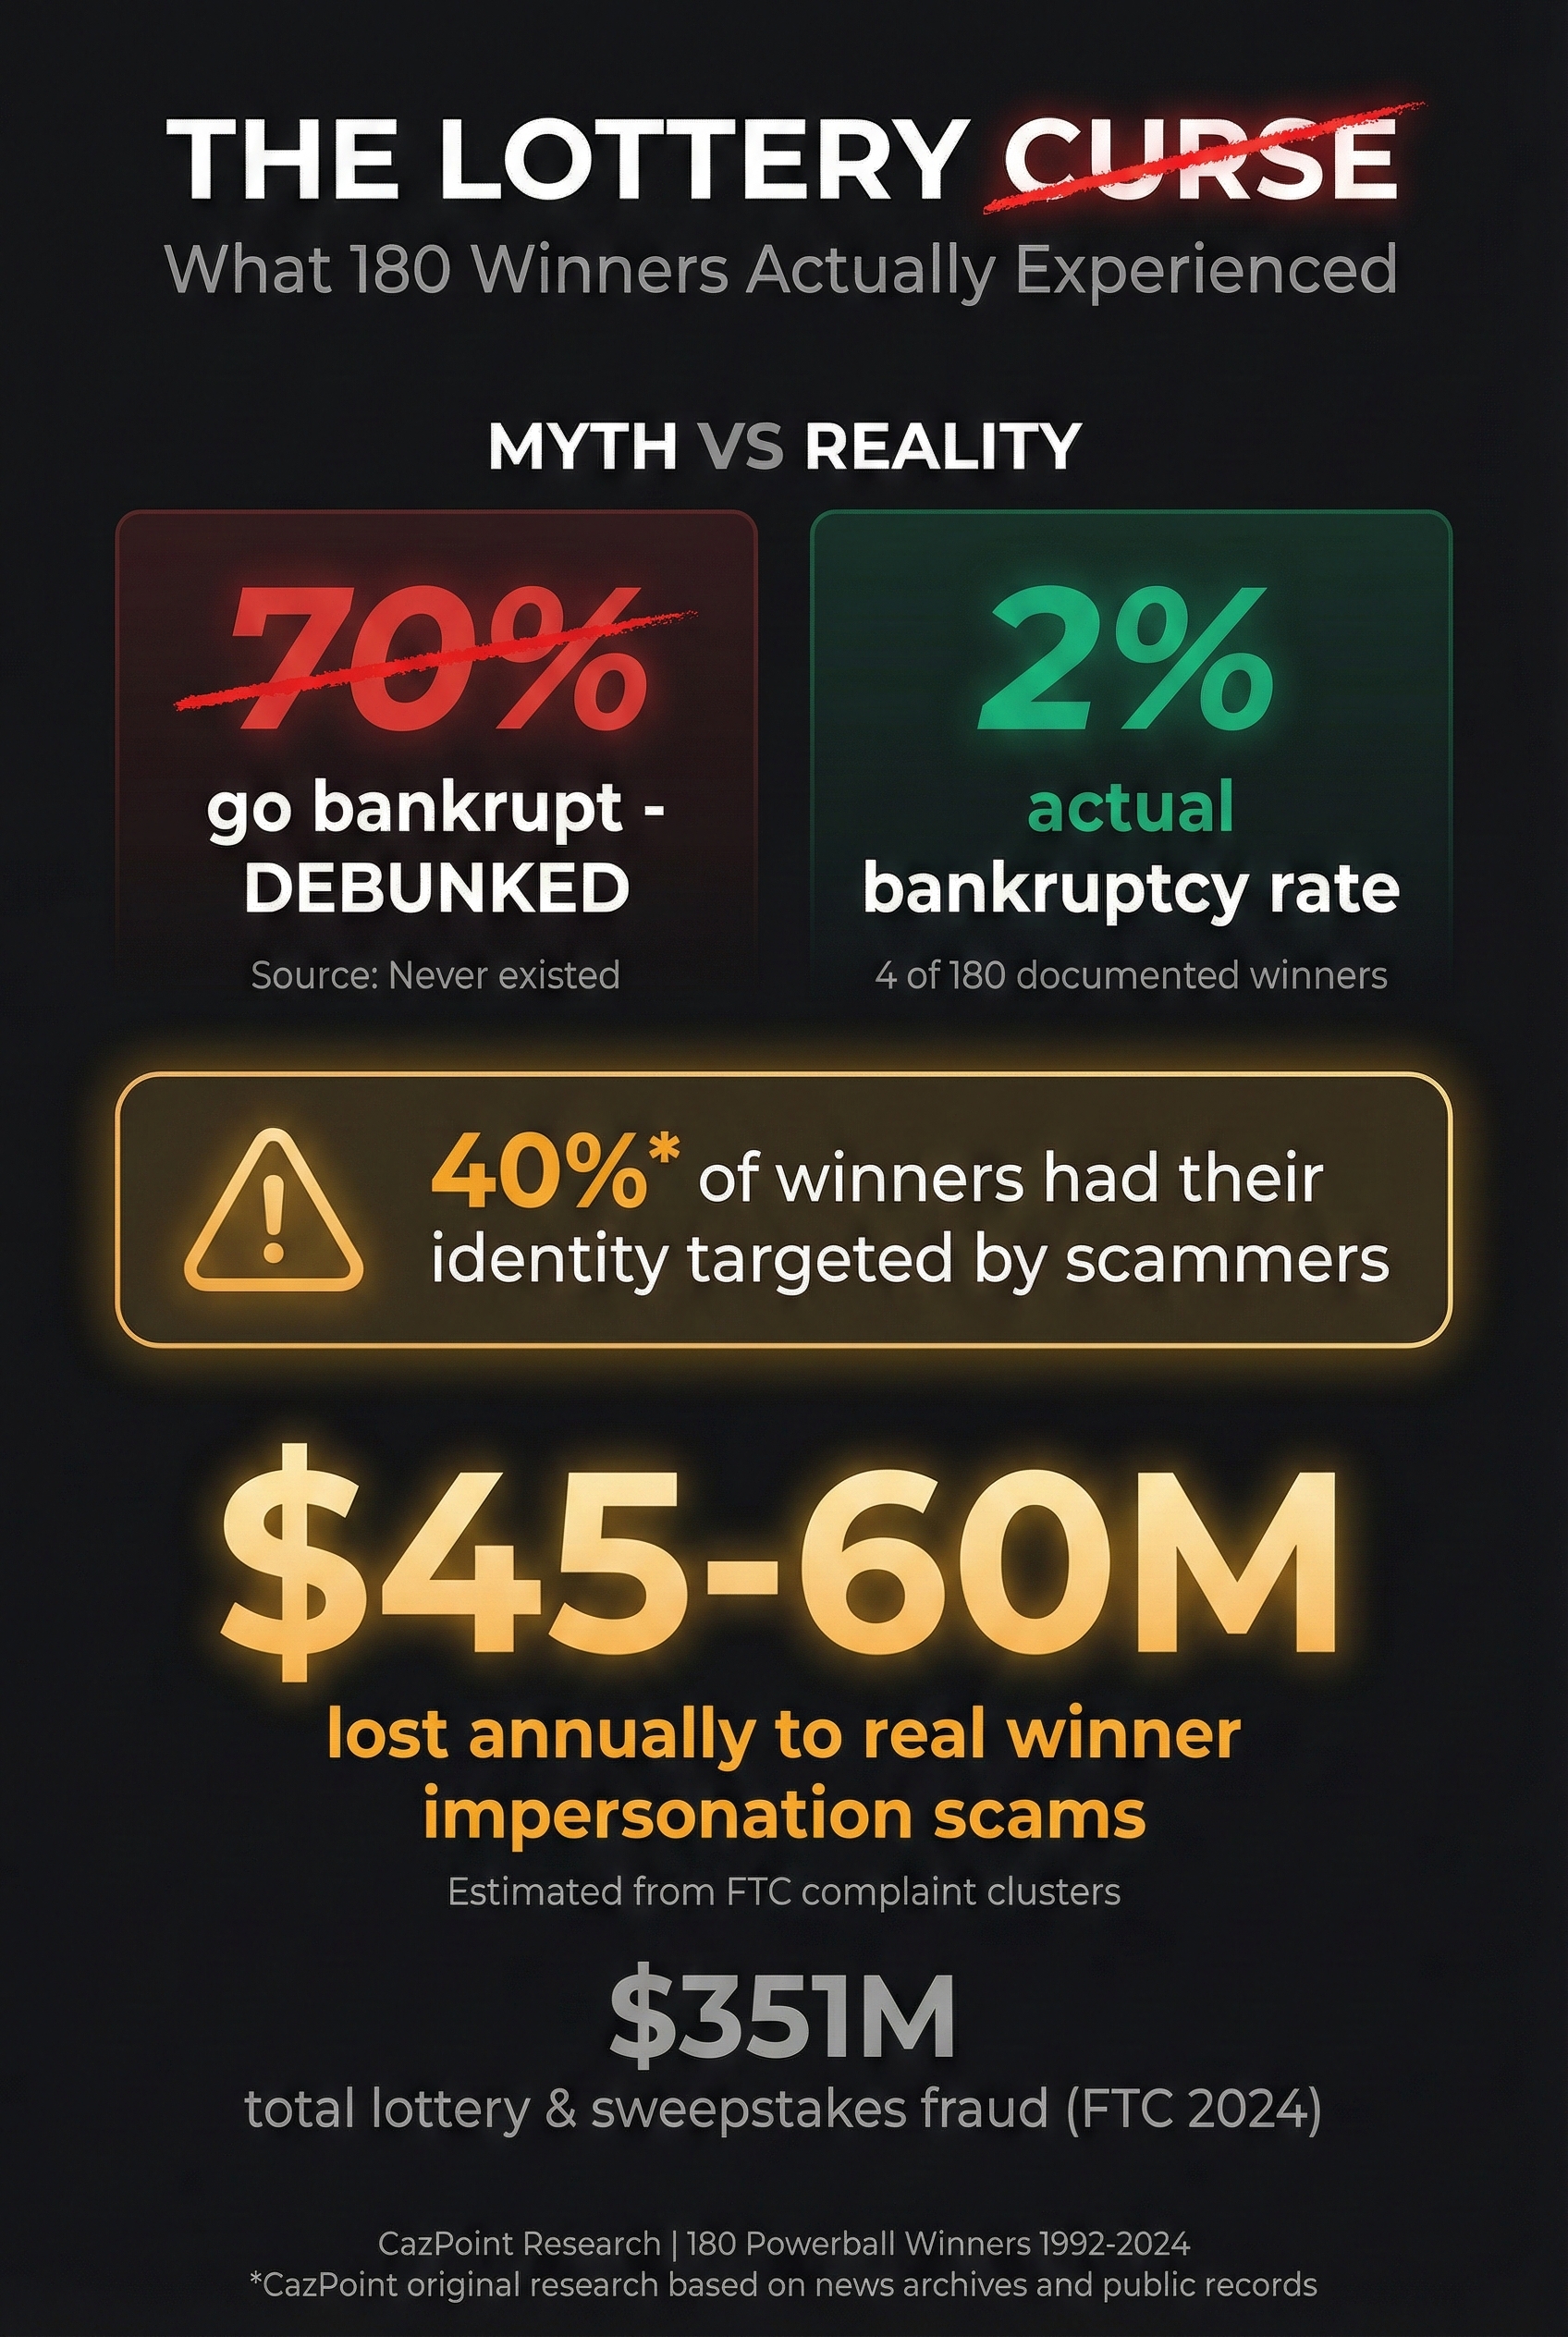
"70% of lottery winners go broke?" We checked 180 cases. Only 4 did.
Executive Summary
Key findings at a glance
For decades, financial media has repeated a terrifying statistic: "70% of lottery winners go bankrupt within 5 years." This claim appears in countless articles, financial advice columns, and viral social media posts.
It's false. Our comprehensive analysis found only 4 cases of financial ruin. That's approximately 2%, not 70%.
"The lottery curse isn't winners going broke. It's thousands of innocent people being scammed using winners' stolen identities."Arina Musina, Lead Researcher, CazPoint
The 70% Myth: Where Did It Come From?
Tracing a misquote that became "fact"
The "70% go broke" statistic has been cited by major news outlets for over 20 years. But when we traced it back to its source, we found something shocking.
The Origin of the Myth
The statistic was originally attributed to the National Endowment for Financial Education (NEFE), a respected non-profit. For years, media outlets cited "NEFE research" as the source.
In January 2018, NEFE officially stated: They never conducted such research. The 70% figure was never backed by any NEFE study.
"Lottery winners go broke"
4 of 162 with documented outcomes
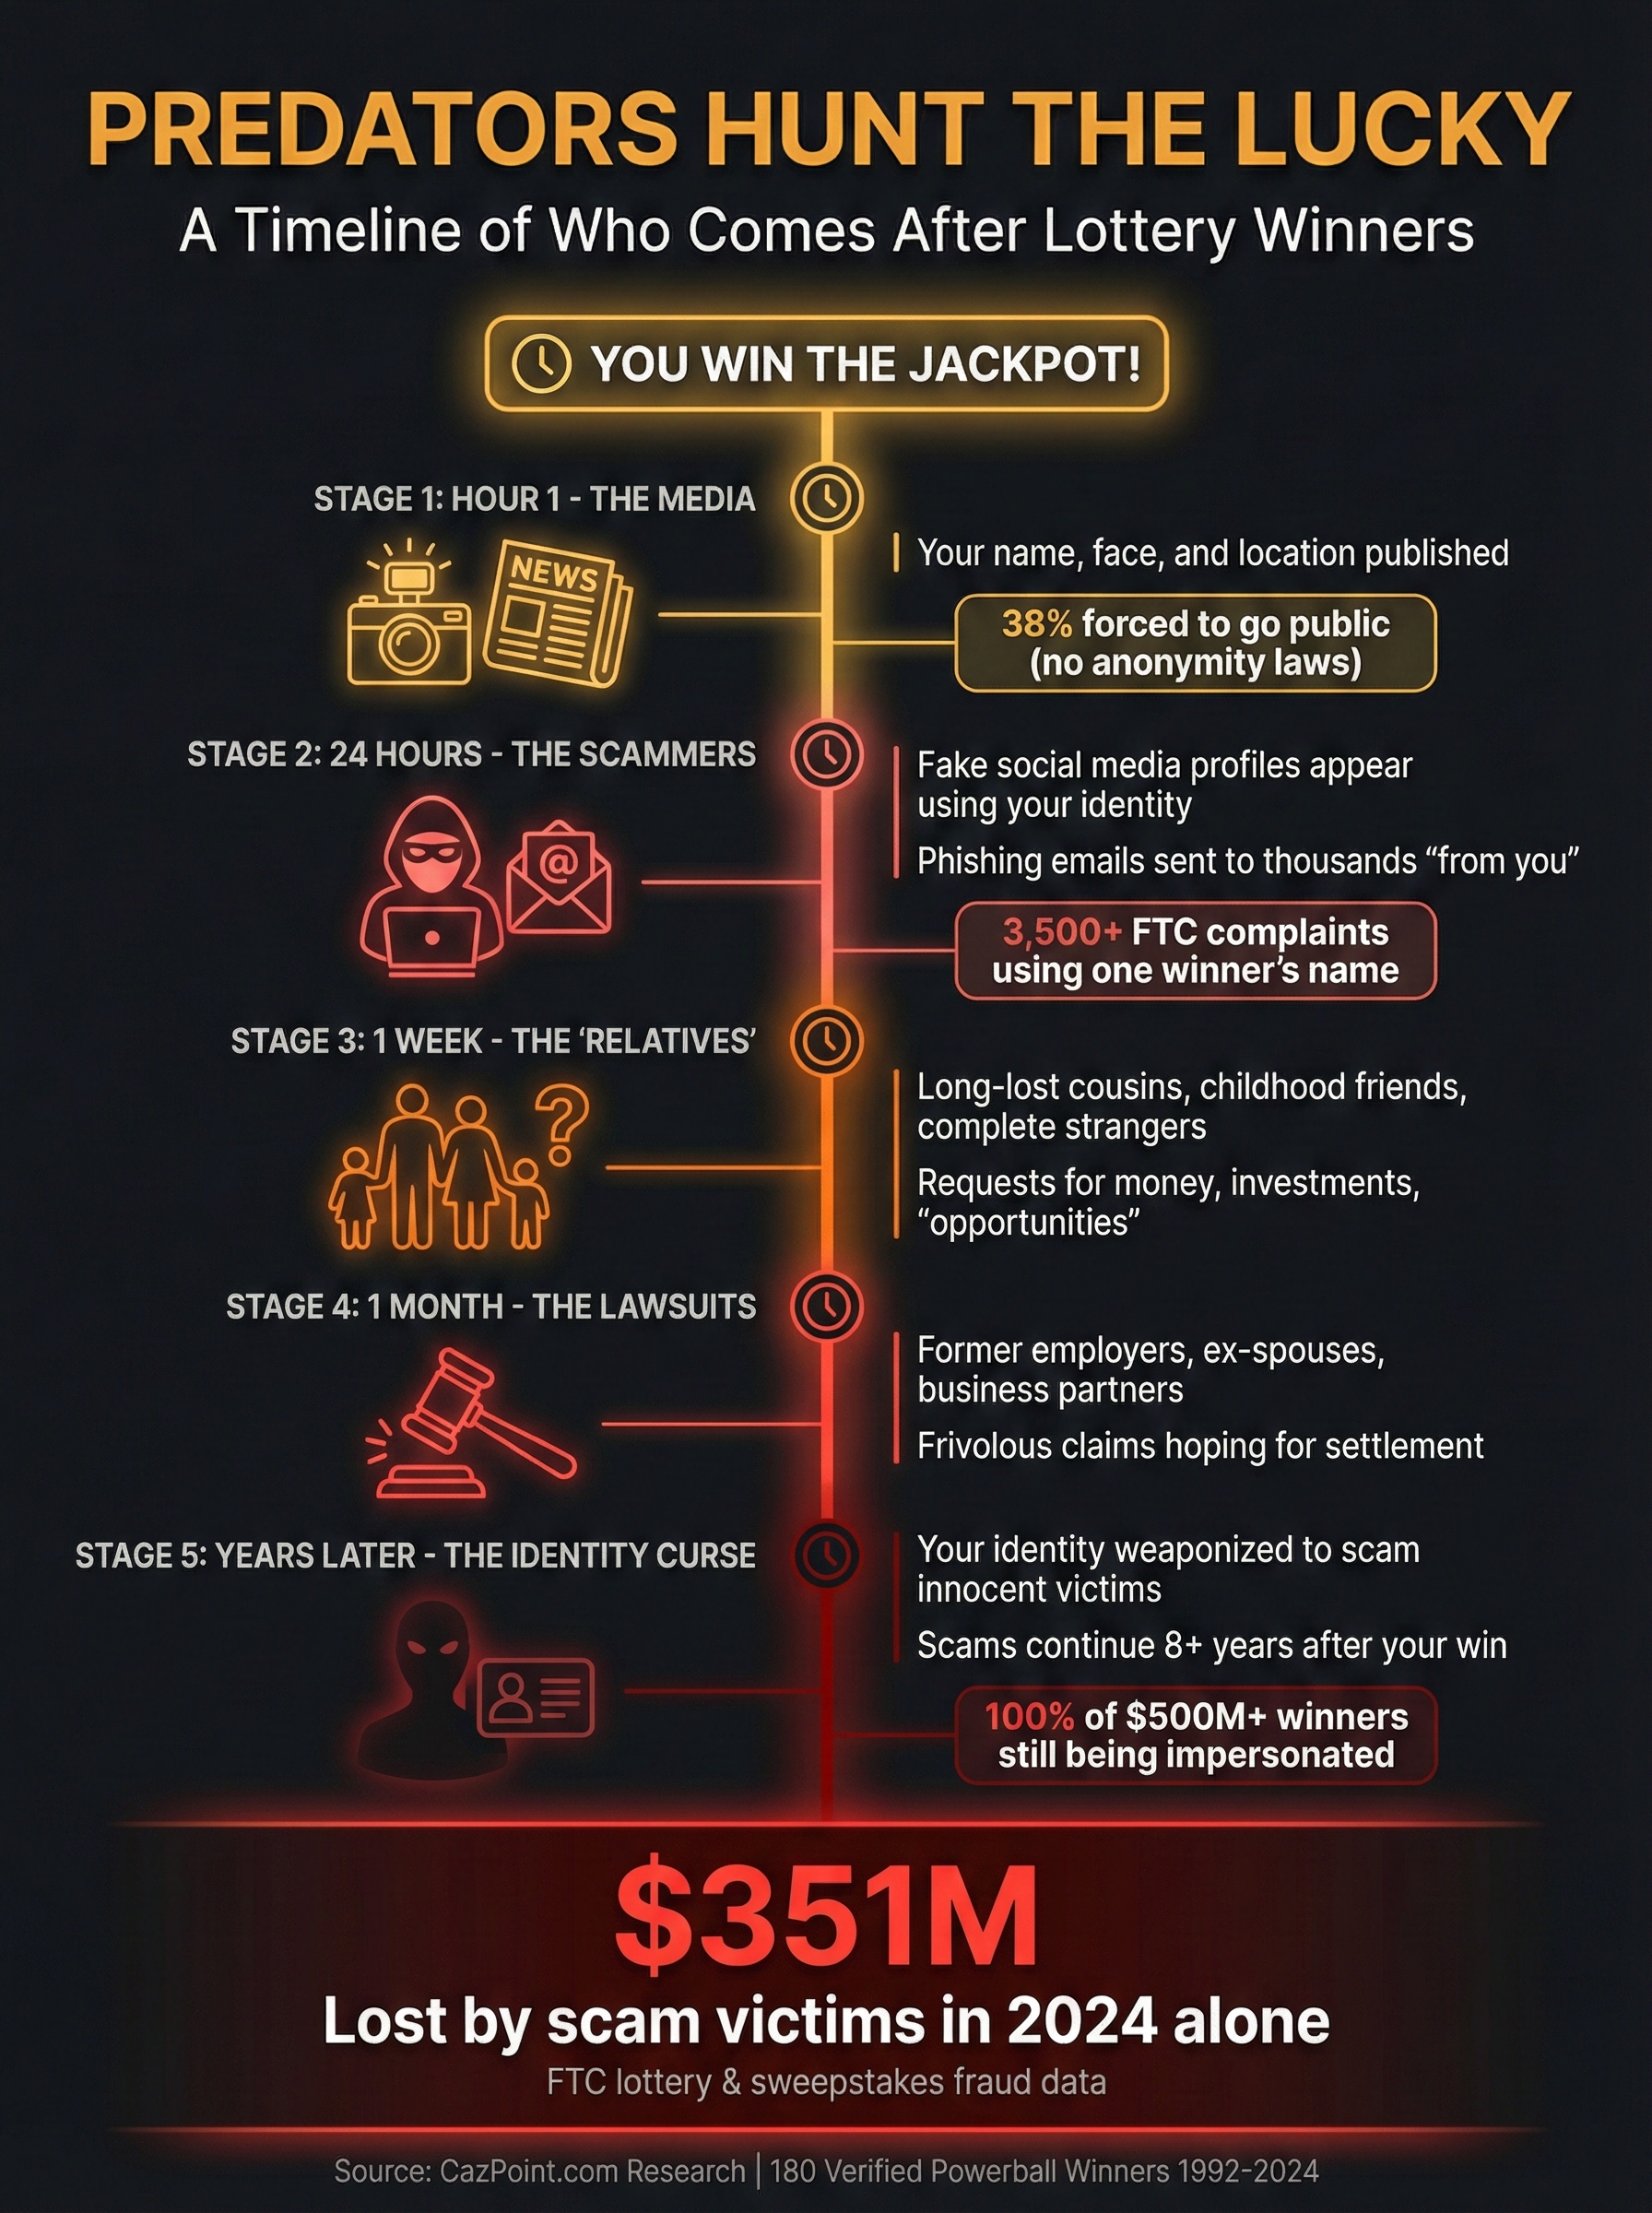
Identity Theft: The Real Curse
What actually happens to winners
While winners aren't going bankrupt, they face a different kind of curse: their identities are weaponized to scam thousands of innocent victims.
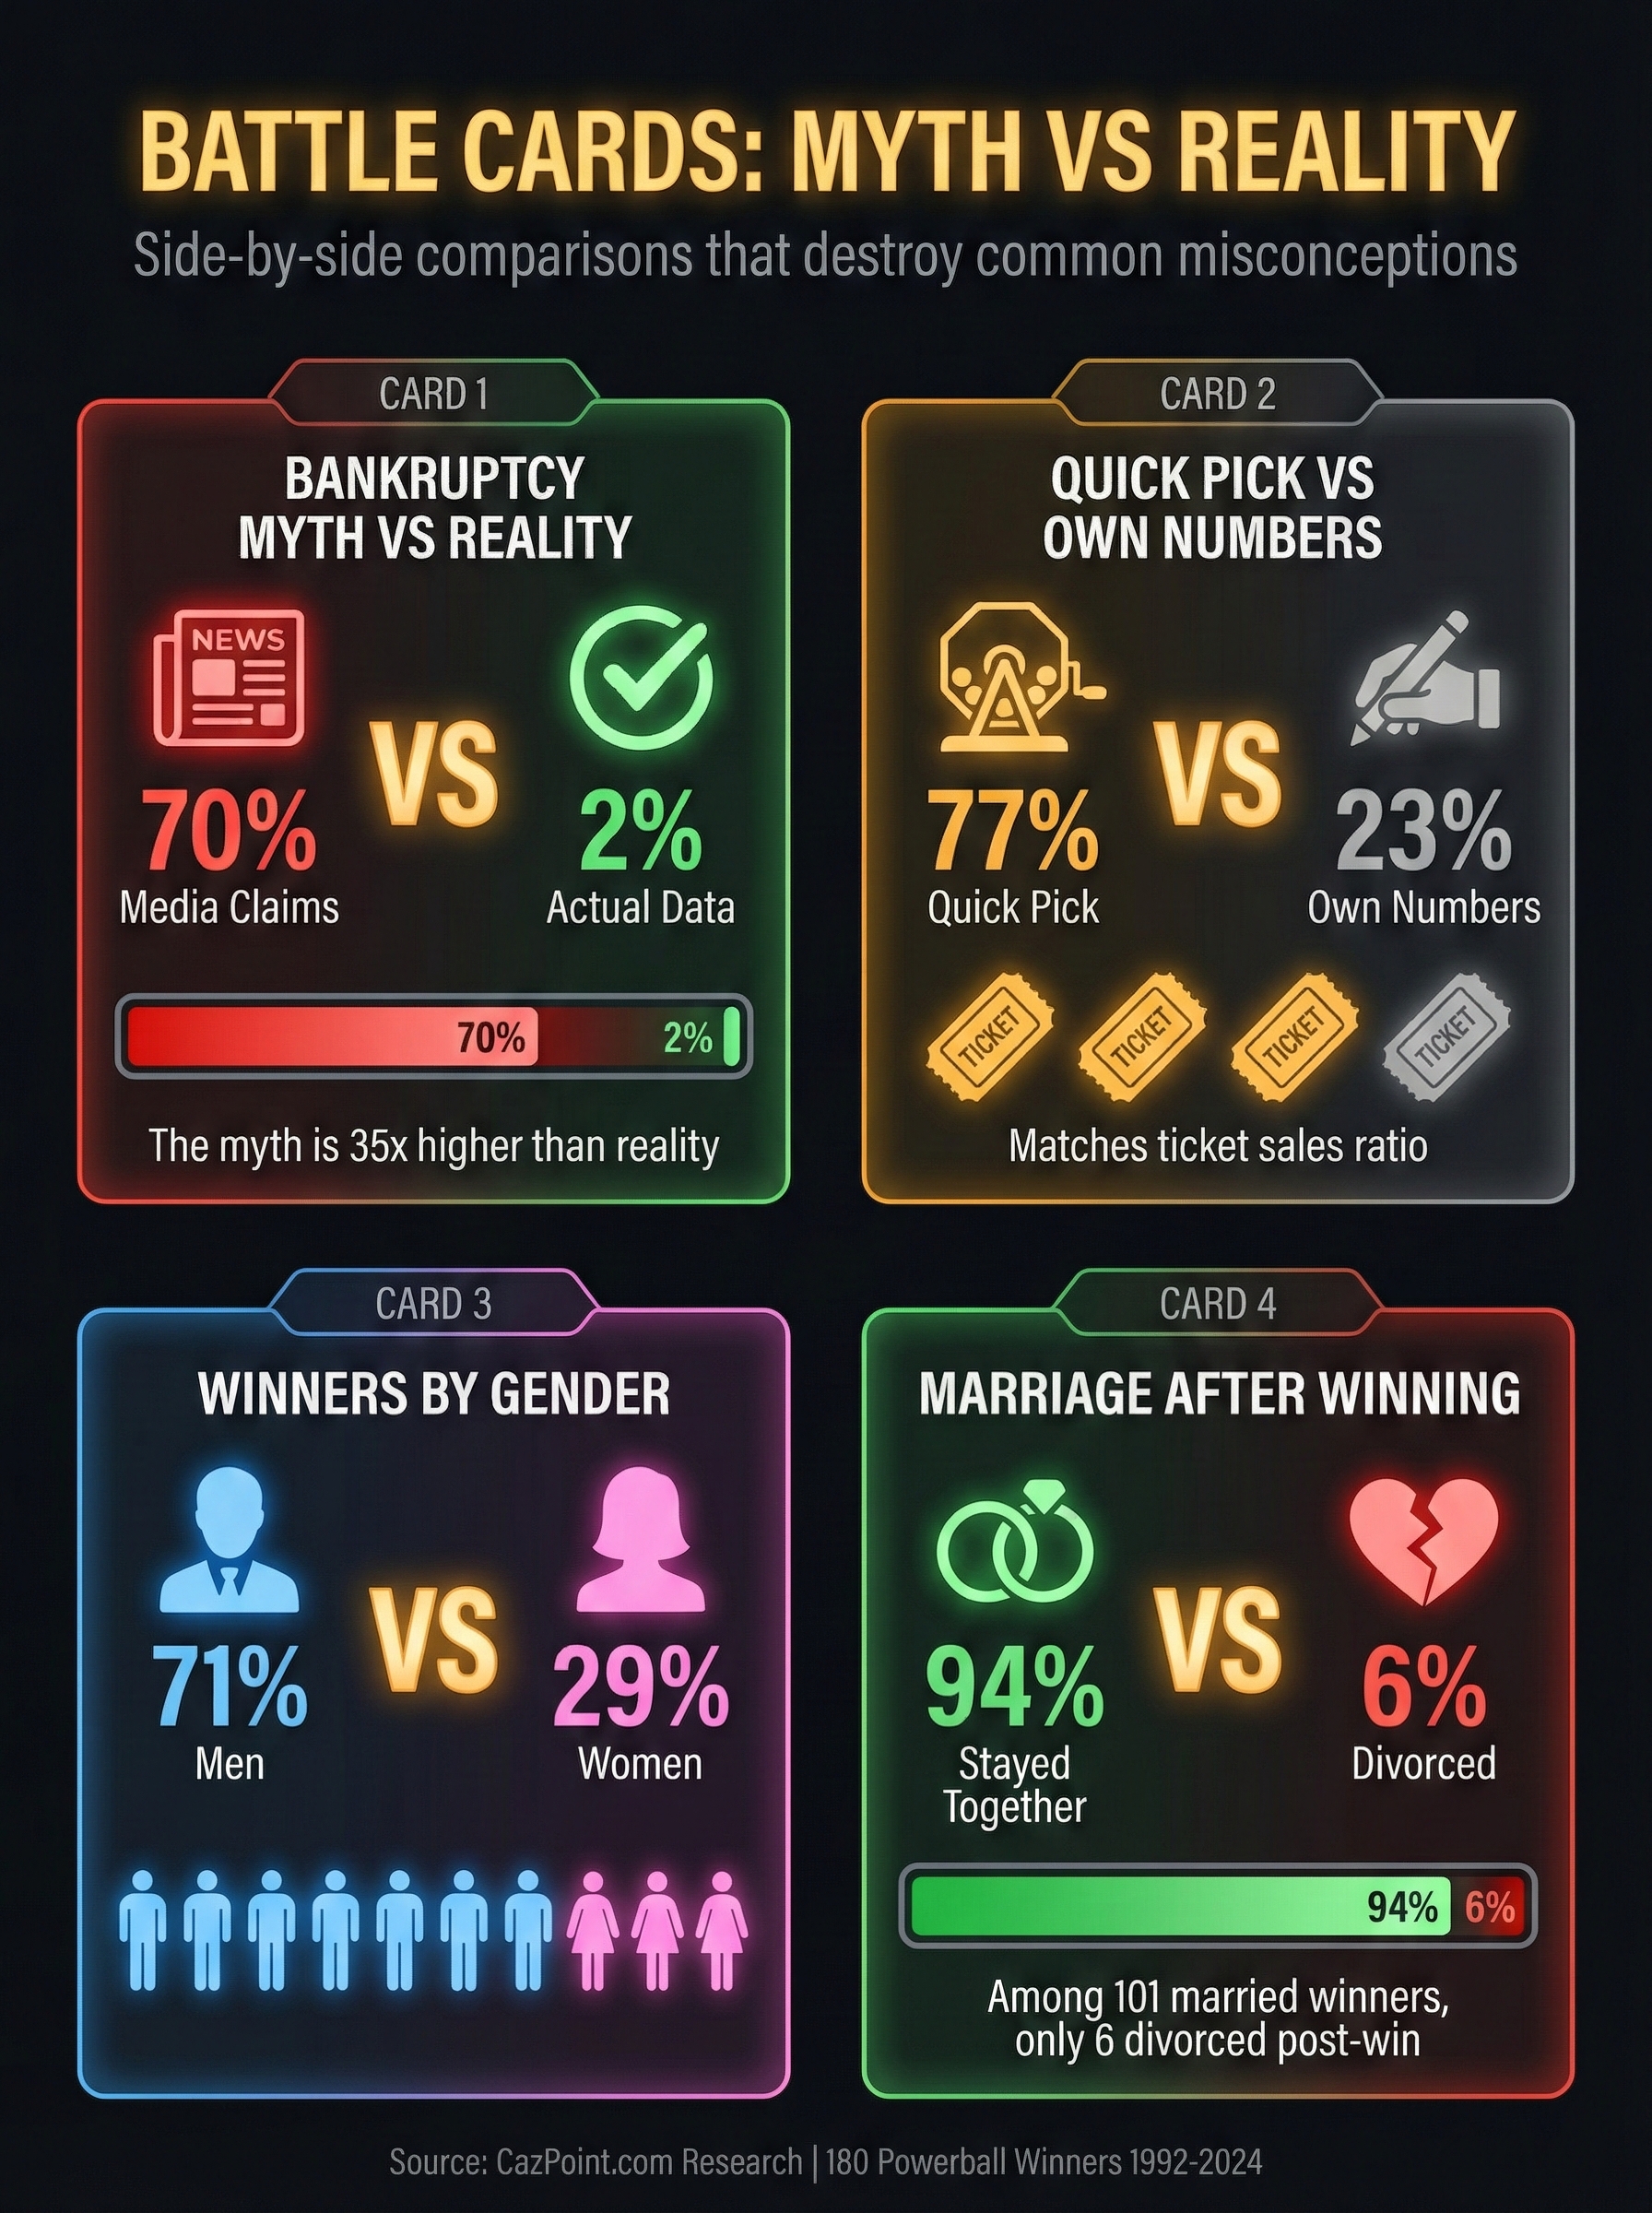
What Winners Actually Do With Their Money
Contrary to the "reckless spending" narrative
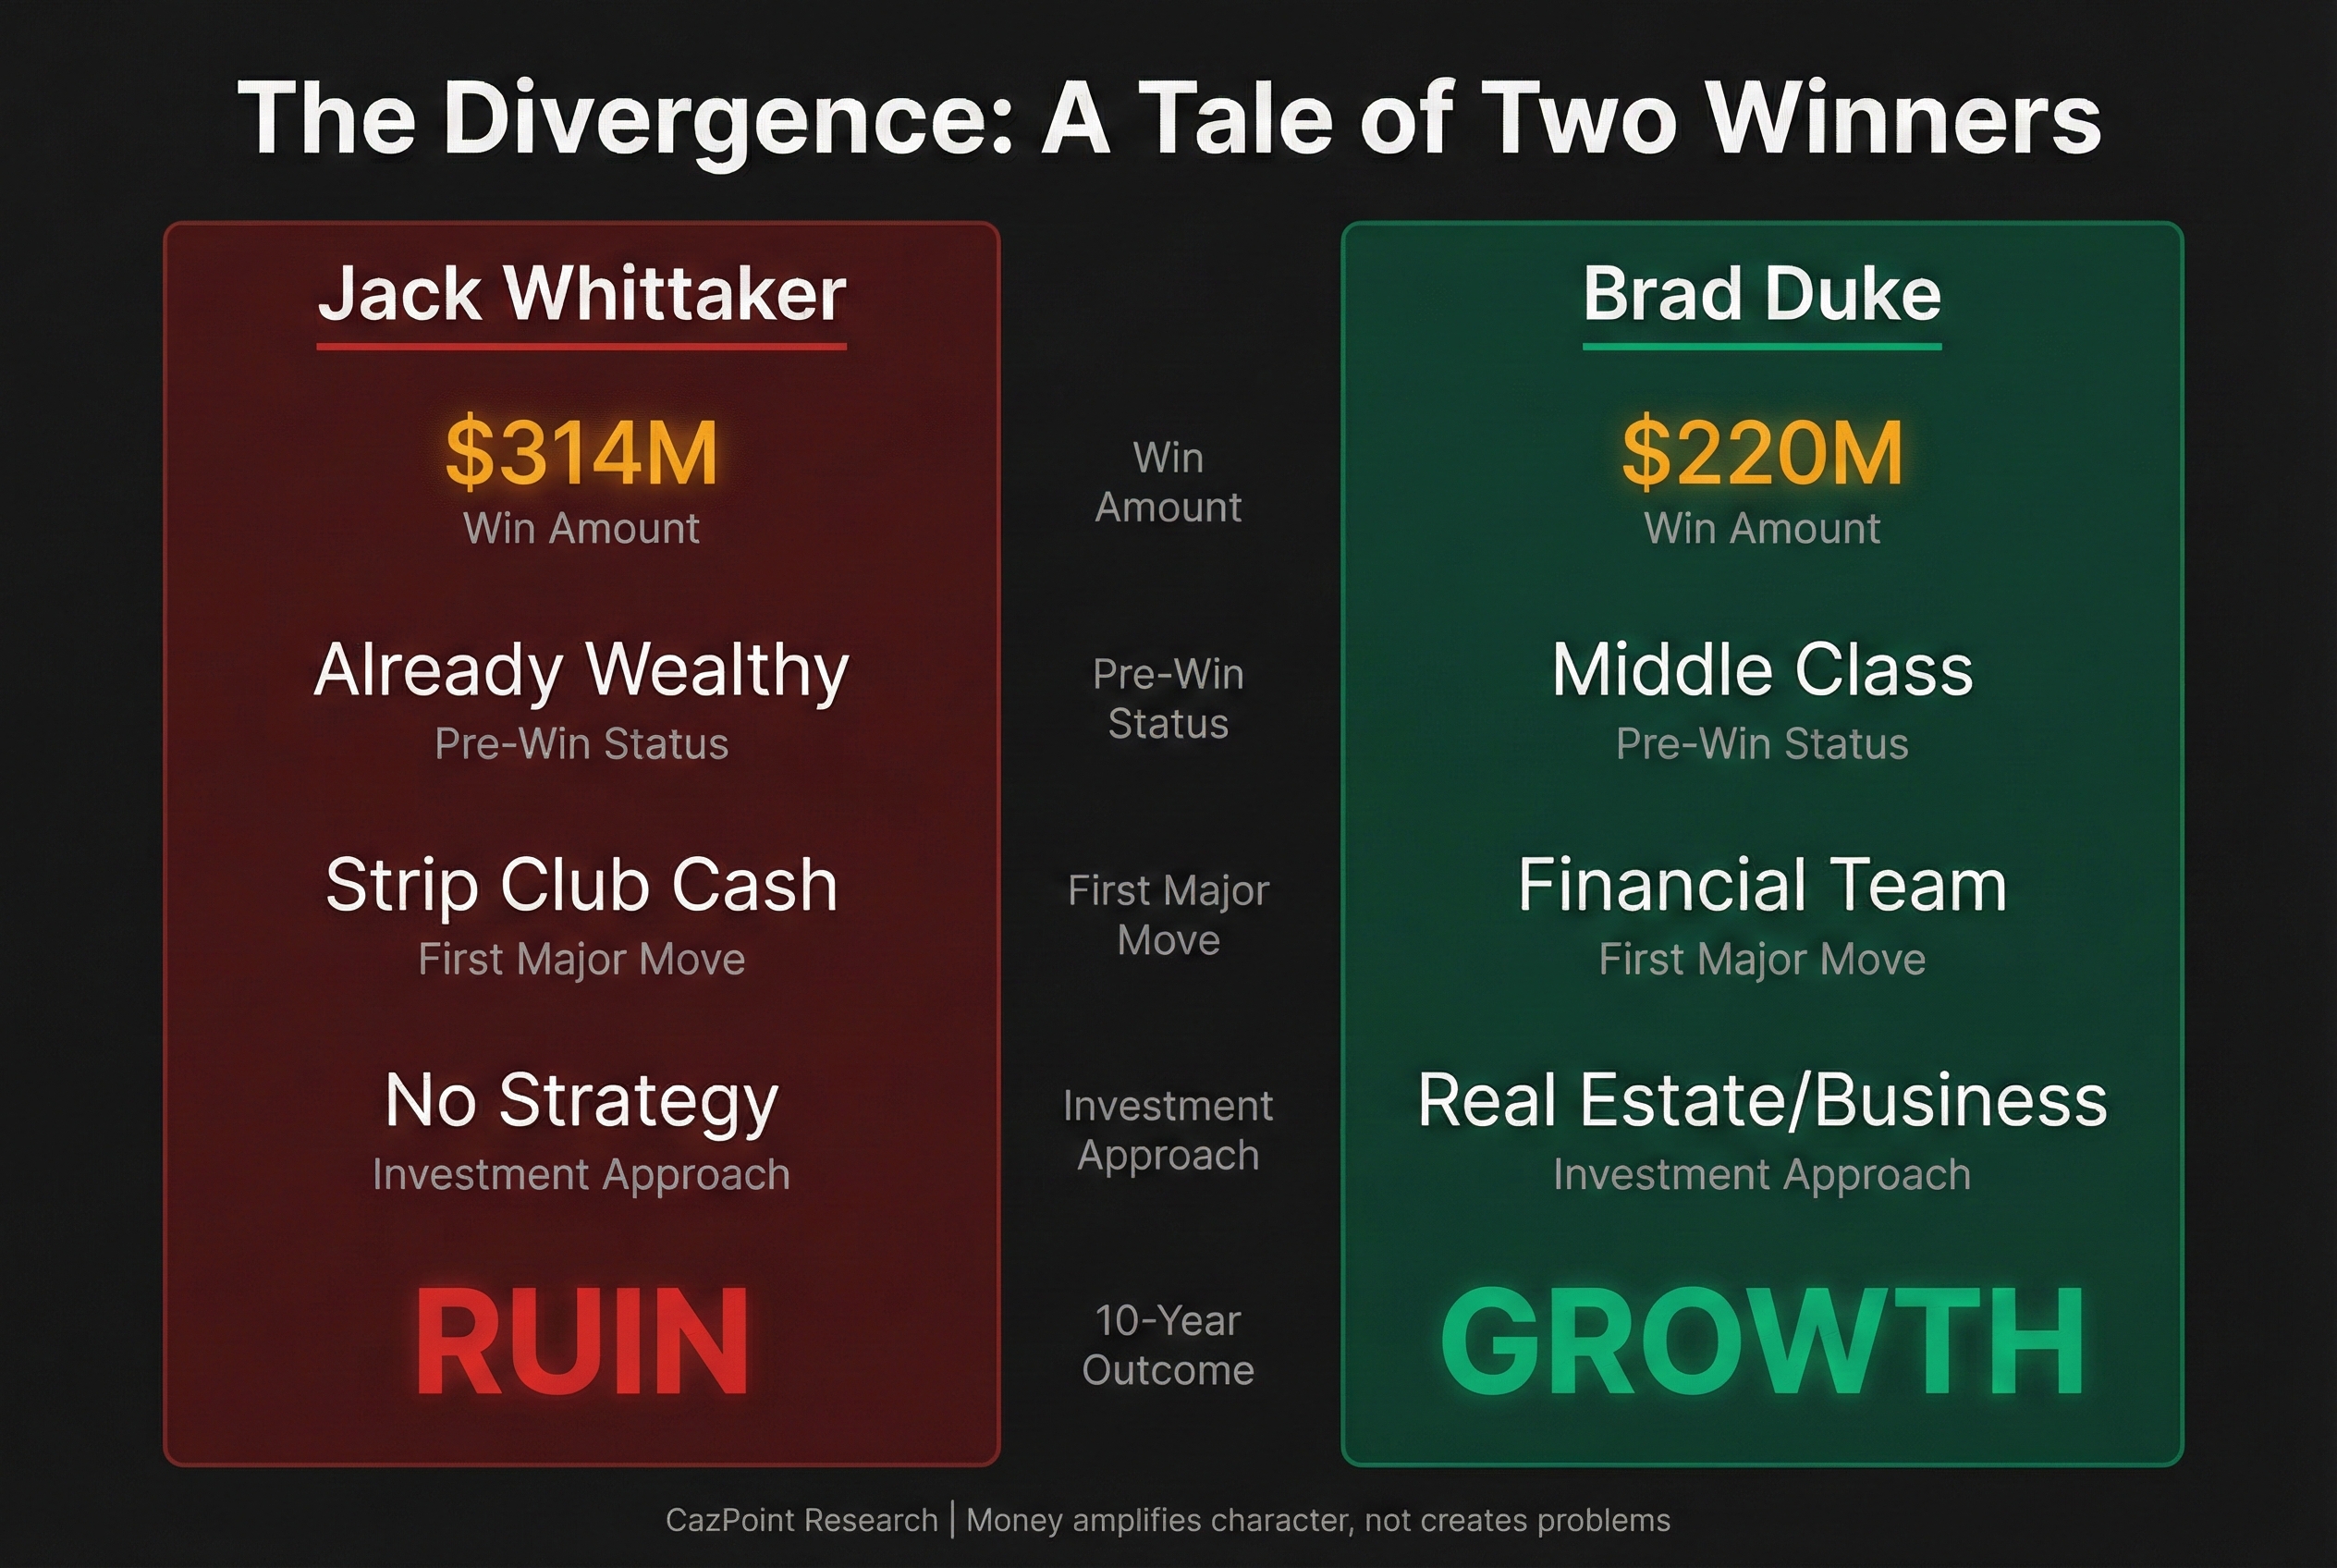
Success Stories: Winners Who Got It Right
The 4 Who Did Go Broke: A Pattern Emerges
When we examined the small number who experienced financial ruin, we found a consistent pattern:
The money didn't curse them. They were already struggling with serious issues before their win.
Who Wins the Lottery?
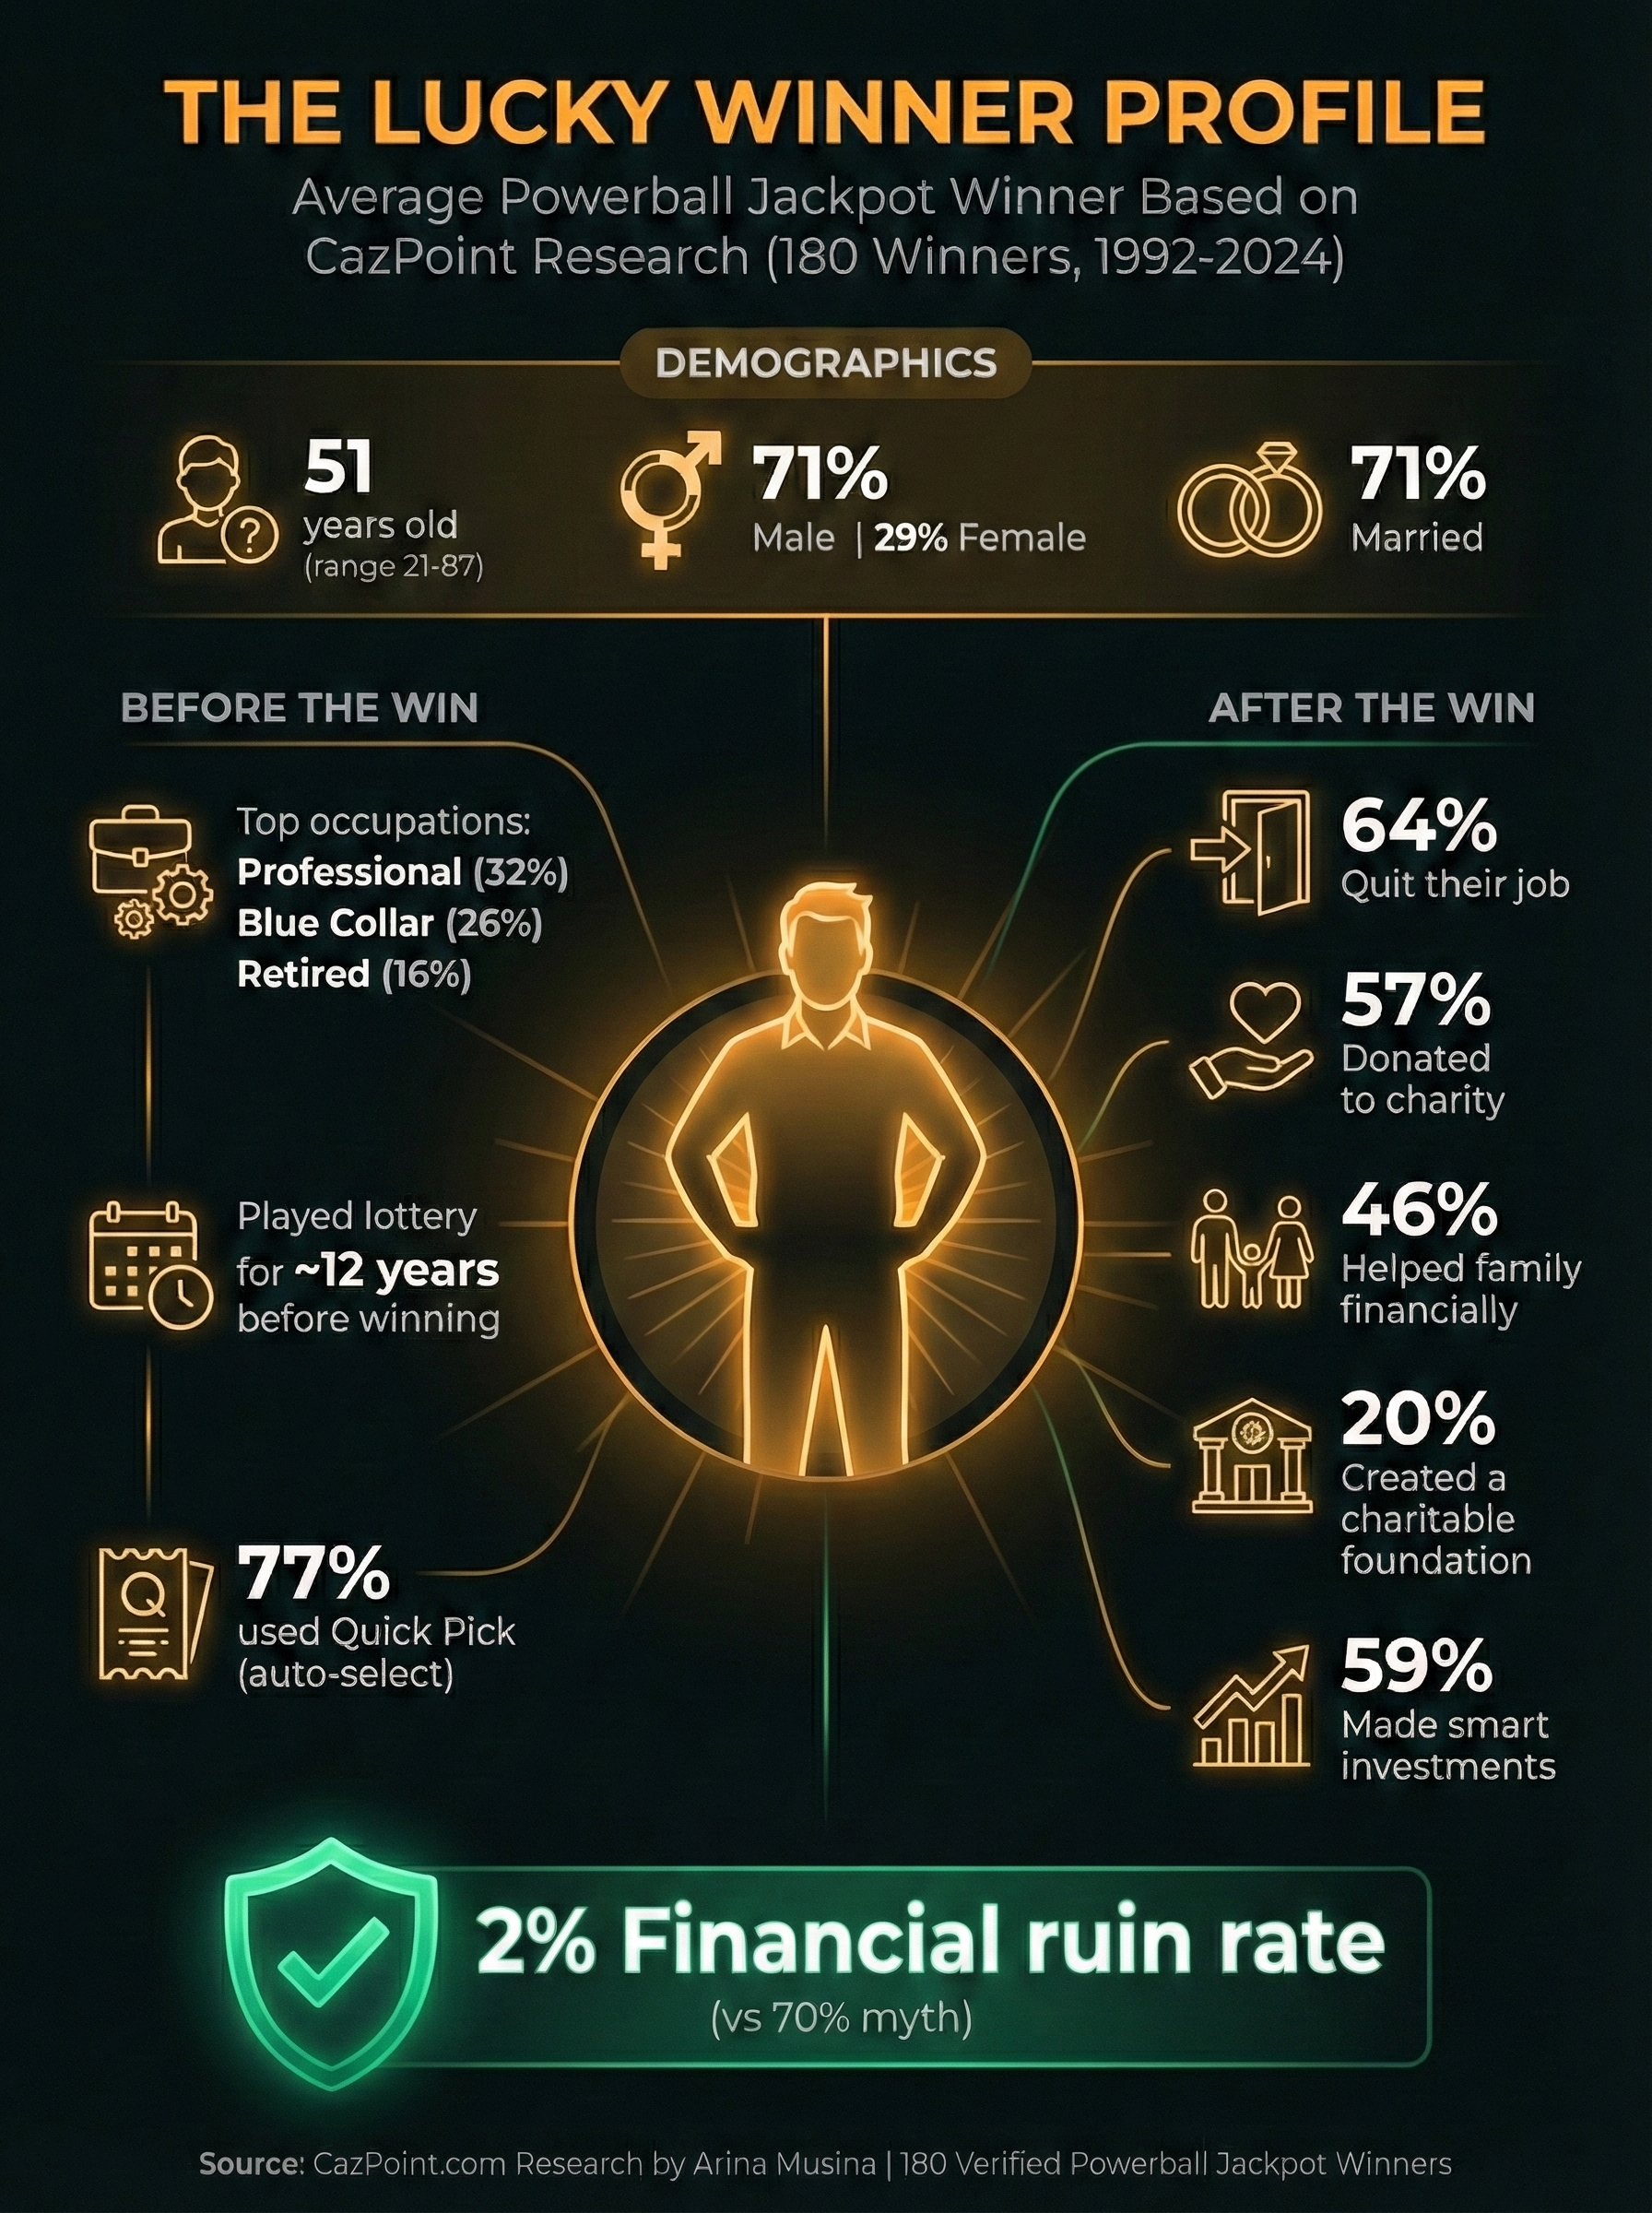
Demographic patterns from 180 winners
The typical Powerball winner is a 52-year-old married man who played for 8 years before winning, using Quick Pick tickets.
Typical Winner Profile
Playing Habits
Quick Pick wins match ticket sales (~70-80% are Quick Pick).
How We Conducted This Research
Methodology and data sources
This study analyzed 180 documented Powerball jackpot winners from 1992-2024, representing approximately 72% of all Powerball jackpots awarded during this period.
Data Sources
- • Official lottery announcements and press releases
- • State lottery commission records
- • Court documents and bankruptcy filings
- • News archives (1992-2024)
- • FTC complaint databases
- • BBB scam reports
Tracking Criteria
- • Financial status (bankruptcy, wealth preservation)
- • Life outcomes (marriage, death, legal issues)
- • Behavioral choices (work, charity, publicity)
- • Identity exploitation incidents
- • Playing history and ticket selection
Transparency Note
For approximately 30% of winners, limited public data is available. All statistics reflect documented cases only. We do not extrapolate or estimate outcomes for winners without verified information.